The Patterns We Trust & The Ones That Betray Us
May 6, 2025

The Kickoff
May we interest you in some perspective shifts? Markets aren’t the only thing in transition this month. From growth factors struggling to deliver, to new thinking on clustering and automation, May is proving to be a reminder that models (and minds) need to stay adaptive.
The Compass
Here's a rundown of what you can find in this edition:
Catching you up on what’s been happening on our side
Newest partner additions to the Quanted data lake
Insights from our chat with AltHub’s CEO, Scott Hall and VP of Partnerships, Jordan Pasternak
Robeco's latest numbers confirm growth factors continue to underdeliver for quants
Highlights from recent quant shifts in the markets
Something to read before trusting your next clustering output
Why we think you should read this intriguing article on fully automated firms
Something Nate Silver said that you may have needed to hear ;)
Insider Info
Last month gave us a chance to trade breadth for depth on both sides of the bridge:
We’ve added many new partners to our ecosystem (see below), spanning fundamental, market, alternative, and macroeconomic sources. It’s a growing range that includes both core staples and more unconventional sources. Exactly the kind of variety that helps uncover orthogonal signals and non-obvious drivers of return.
On the flip side several funds now have our Data Bridge running side‑by‑side with production models. Early verdict: clearer attribution and quicker “go / no‑go” on prospective datasets. Exactly the kind of daylight quants need to keep up with the explosion of available data sets.
Behind the scenes, our internal data graph just crossed 25,000 features. For us this is solid step up in scale, precision, and analytical depth. We’re excited by the trajectory and have plenty more lined up in the weeks ahead.
On the Radar
We've welcomed many new data partners this month, each enriching the pool of features quants have at their fingertips. All ready to unpack, test, and integrate into their strategies. A warm welcome to the partners below:
Our News Sentiment Analysis & Topic Modelling gives quantitative traders a powerful edge by transforming real-time news into structured, tradable signals. Seamlessly integrated into models, it enhances alpha generation, improves timing, and diversifies data inputs—helping traders react faster, backtest smarter, and forecast markets more effectively.
Finage delivers ultra-low latency, highly accurate financial data designed to optimise quantitative models, enhance backtesting, and accelerate strategy deployment across multiple asset classes.
The keys to quantitative analysis include a robust data sample, long data history, structured data and a consistent sample. MedMine’s QuantHC Data feed checks all these boxes with a sample representing more than 20% of the population, more than a decade of history and several years of point in time data. Quantitative analysts are easily able to test different strategies and perform reliable backtests on data that is structured, tickerized and actively maintained for corporate actions like mergers , acquisitions and divestitures.
Provides quant firms with machine readable, time stamped, ticker tagged and category coded newsfeeds delivered in real-time and over 15 years of historical archives to meet the key needs of this segment of financial services.
Delivers ground truth-validated footfall data for 600+ tickers, enabling quant teams to model retail performance with up to 0.98 correlation to reported sales and outperform alternative datasets in backtesting.
Podchaser
Transcribes unstructured podcast audio into quantifiable data, enabling funds to incorporate this rich source into their alpha generation strategies.
The Tradewinds
Expert Exchange
We recently sat down with AltHub’s CEO Scott Hall and VP of Partnerships Jordan Pasternak, who are helping companies across industries unlock new revenue by transforming raw operational data into valuable investment signals.
With 25 years of experience scaling enterprise technology and data businesses, Scott has led high-performing teams across finance and energy markets, driving growth in data management, trading systems, and analytics products for institutional investors. Jordan brings over a decade of experience working closely with early-stage fintech and software ventures, building strategic partnerships and guiding startups toward successful market adoption within institutional finance.
Now, they’re applying that experience to build a platform that turns previously untapped datasets into clean, structured inputs ready for use across institutional investment workflows.
Since founding AltHub, how has alternative data usage in investments changed, and what has been the most formative shift you’ve experienced?
The most formative shift we’ve witnessed is how quickly once-niche datasets—like credit card and geolocation data—have gone from “curiosity” to “table stakes.” This evolution happened in under five years and highlighted how rapidly investors adopt any dataset that delivers a measurable edge. It also reinforced our decision to treat validation and usability as necessities, not afterthoughts.
In the last 18 months, we’ve seen an acceleration in platform and AI development that’s shrinking the gap between what data sellers provide and what investment teams need. Alternative data is being delivered in far more usable and impactful formats, reducing the friction of adoption and making high-quality, insight-ready data more accessible than ever.
What would you say are the three skills or habits that have most shaped your ability to build and scale a differentiated data company?
Patience – Building meaningful relationships and integrations takes time.
Perseverance – Conviction is key when you're introducing a new model into a high-stakes ecosystem. Every proof-of-concept, pilot, and delay has helped us refine the product and build trust.
Ecosystem awareness – Staying plugged into both market and regulatory shifts has helped us evolve AltHub from a connector to a strategic infrastructure layer for the alt-data economy.
Could you provide a couple of technical insights or innovations in alternative data sourcing or processing that you believe would be particularly interesting to investment professionals?
Consumption-based, ticker-level licensing
Instead of paying for entire datasets up front, investment teams can now run targeted queries—by ticker or industry—and pay based on usage. This model aligns cost with value and makes experimentation far more scalable.AI-driven automation
Intelligent agents now assist with entity resolution, automated quality checks, and matching buyers with sellers based on strategy, holdings, or sector interests. These AI tools drastically reduce costs while enhancing precision and speed.Plug-and-play composability
Our data layer enables seamless combination of third-party and proprietary datasets. This plug-and-play approach dramatically reduces the engineering lift needed to test hypotheses or run investment backtests.
Aside from AI, what major trends do you see having the most profound impact on operational data commercialisation over the next decade?
Consumption-based pricing proliferation
As budgets come under more scrutiny, the industry is shifting toward metered billing models that reward relevance and control spend.Regulatory and privacy constraints
Grey-area datasets—like scraped personal data or mobile geolocation—are facing increasing legal and ethical scrutiny. We expect a greater premium on compliant, privacy-conscious datasets.Alpha decay
As alternative data becomes more mainstream, early alpha signals erode. What was once differentiated becomes commoditized, pushing vendors to continuously evolve their offering and stay ahead of the curve.
As more non-traditional providers enter the alternative data market, how do you see the relationship between data vendors and investment teams changing?
With more non-traditional providers entering the space, third-party validators like AltHub are becoming essential. We act as the “initial filter” by validating data quality, assessing liability risk, and enriching raw feeds so they’re ready for financial analysis. This dramatically speeds up the sourcing and diligence process and gives investment teams more confidence in evaluating novel datasets.
What is the next major project or initiative you’re working on, and how do you see it improving the alt-data domain?
We're rolling out a self-serve transformation agent that takes raw datasets and automatically maps them to ticker hierarchies and relevant market data. This turns static files into investment-ready datasets in minutes—not weeks—unlocking massive efficiency gains for both data buyers and sellers.
Anything else you’d like to promote?
AltHub will be exhibiting at Neudata’s New York Summer Data Summit on May 8th. Come visit our booth for a live demo and to see how we’re making alternative data faster, cleaner, and easier to monetize for both providers and users.
Numbers & Narratives
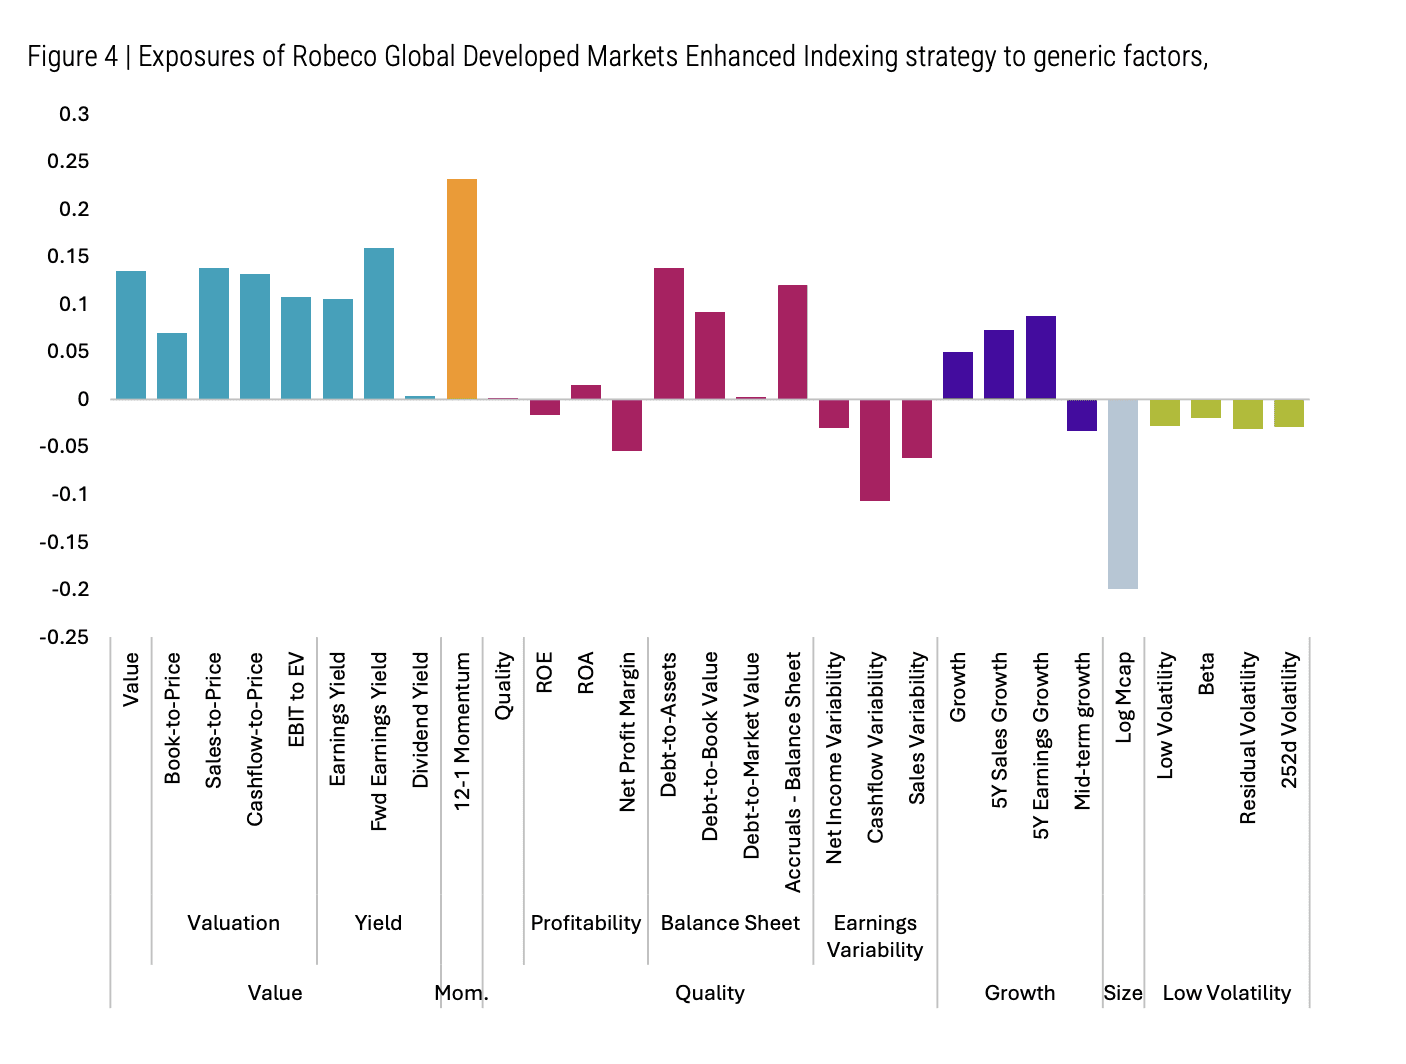
Growth Factors: Why the Numbers Still Don't Add Up
Robeco’s April 2025 factor analysis examines whether growth deserves independent status alongside proven quant factors. The numbers, covering over six decades of US equity data, suggest that while growth narratives are persistent, actual factor returns consistently disappoint.
Key stats from Robeco's analysis:
Classic value and quality factors (like EBITDA/EV, FCF/Price, and operating profitability) maintain robust annual premiums between +5% and +7%.
In contrast, traditional growth definitions underperform significantly:
Sales growth factors returned approximately -2% per year, reflecting persistent investor over-extrapolation.
Profitability growth, often considered a more robust version of growth, still only achieved modest annual returns of about +2%.
Robeco’s own Enhanced Indexing strategy explicitly reflects this insight. Their factor exposures (see chart below or figure 4 of the report) show negligible direct weighting to standalone growth measures, while strong tilts towards value and momentum dominate.
Yet, Robeco highlights a subtlety critical for quant investors: many signals labeled as "growth" (such as earnings revisions or business momentum) are actually proxies for sentiment or short-term information flow. These metrics correlate strongly with known profitable signals, but fail the test of uniqueness required to qualify as standalone factors.
For quants, the practical implications are clear:
Pure growth metrics (EPS trends, sales growth, etc.) rarely justify standalone inclusion in factor models, given their historical performance.
If your model includes explicit growth metrics, carefully test these exposures for redundancy against established factors.
Regular clustering or correlation checks can ensure your factor definitions remain clear, avoiding unintentional duplication and ensuring optimal allocation.
In short, the evidence reinforces skepticism about standalone growth: it might show up in your narratives, but as a factor, the numbers simply don't support its independent allocation.
Source: Robeco July 2024 in the Robeco April 2025, The many faces of growth report.
Market Pulse
Hot off the Vol Press
Volatility surged in April as U.S. tariffs sent the S&P 500 below 5,000 (which has since recovered) and reignited policy-driven uncertainty across asset classes. But while the VIX spike reflected shock, Ben Powell of BlackRock cautions that the rebound was powered more by strong AI-led earnings than a reduction in risk; suggesting quants must distinguish signal from sentiment, especially when volatility clusters around macro catalysts. Robyn Grew of Man Group reframes that volatility as a structural feature, not a disruption, calling for strategies that thrive amid dispersion and adapt across unstable trend cycles. Warren Buffett’s perspective complements this, viewing drawdowns as intrinsic to investing. Volatility, in his framing, is the cost of long-term opportunity, not a risk to be avoided. Together, these views imply that quants must evolve beyond static factor models and design architectures that are not volatility-aware, but instead volatility-integrated, where instability becomes a source of edge rather than friction.
QT Is Still Not a Cutie
With the Fed’s balance sheet down to $6.7 trn, 25 % below its 2022 apex and back to a 22.4 % assets‑to‑GDP ratio it's clear that QT has bitten, yet reserves remain ample enough that policymakers sliced April’s Treasury runoff cap to $5 bn to protect money‑market plumbing. Treasury and MBS holdings alone rolled off about $19 bn in April, keeping term‑premia biasing upward even as the pace moderates. In London, the BoE postponed its £600 mn long‑gilt auction after a tariff‑linked surge pushed 30‑year yields over 5 % and spotlighted how duration risk can derail passive schedules. The BoE's rate sitter's call for “targeted, temporary” QE reframes balance‑sheet policy as a bidirectional shock absorber, not a one‑way valve. Quants should therefore flag state‑contingent liquidity regimes, stress‑test for sudden micro‑QE insertions, and monitor duration gaps as domestic nonbanks absorb heavier gilt supply over the next few quarters.
Navigational Nudges
Clustering Fails When Distance Fails
When clustering breaks down in financial time series, it’s rarely due to the algorithm. The issue usually lies in the distance metric. Cosine, DTW, Mahalanobis — each carries different assumptions about structure, similarity, and noise. In high-dimensional or noisy data, these choices can override the actual information and mislead the clustering entirely.
Here’s where distance metrics go wrong and what to do instead:
1. Cosine Distance: Clean for Direction, Dirty for Noise
Cosine distance is effective when the goal is to compare directional exposure, like factor loadings or normalised returns. It ignores scale, which helps isolate the pattern or profile of variation. But when volatility is low, the angle between vectors becomes unstable and noise dominates. This creates artificial similarity between unrelated series. To mitigate this, normalise returns using EWMA volatility or z-scores. If clusters still appear overly uniform, revisit your assumptions about the signal-to-noise structure.
2. DTW: Powerful, but Prone to Overfitting
Dynamic Time Warping is useful when timing mismatches are meaningful, such as delayed responses across sectors or markets. However, it can over-align noise, bending the series in ways that fit randomness rather than real patterns. Adding constraints like Sakoe-Chiba bands can limit this overfitting, and derivative DTW can help suppress random fluctuations. For shorter time series, simpler distance metrics may be more appropriate.
3. Mahalanobis: Smart with Good Covariance, Risky Without It
Mahalanobis distance captures co-movement across multiple variables, making it valuable in a factor-driven world. But the quality of results depends on the stability of your covariance estimate. With limited samples or fat-tailed returns, the estimation error can produce misleading proximity. Robust estimators like Ledoit-Wolf shrinkage or M-estimators improve reliability. It's also worth testing cluster stability over time — if membership flips frequently, the metric may be overly sensitive to short-term noise in correlation structure.
4. If Clusters Flip, Blame the Metric First
Unstable clustering often points to poor distance specification rather than poor data. A quick test is to apply multiple metrics across the same data and track agreement. Low overlap suggests structural ambiguity or a mismatch between metric assumptions and data behaviour. In these cases, building a voting system across distance types can help. Accept only clusters that appear consistently. Others may require context-specific modeling or more refined feature engineering.
5. One Distance Doesn’t Work Everywhere
Every distance metric carries a view about what matters — alignment, direction, spread, or factor structure. In quiet markets they often produce similar outcomes. In noisy markets, they diverge. That divergence is where useful information lives, as long as you know what each metric is prioritising. Choosing a distance metric is a modeling decision. It’s a bet on what structure you believe exists, and what kind of noise you expect to dominate. Reliable, stable estimates are especially critical if you're using clustering outputs in downstream tasks like risk targeting or minimum variance portfolio optimisation.
In the end, clustering outcomes are only as reliable as the structure your distance metric is built to recognise.
The Knowledge Buffet
📝 What fully automated firms will look like 📝
by Dwarkesh Patel
Most of us still picture AI as a smarter teammate. Here's a piece that will challenge that ideology. It forces a different lens — firms made entirely of AIs, scaling through replication and merge, not headcount. It’s speculative, sure, but as a quant, the parts on coordination costs, information transfer, and compute-as-talent feel highly relevant and we couldn't help but recommend it. Worth the read even if it's just to reframe how to think about scale.
The Closing Bell
“Distinguishing the signal from the noise requires both scientific knowledge and self-knowledge: the serenity to accept the things we cannot predict, the courage to predict the things we can, and the wisdom to know the difference.”
- Nate Silver
The Kickoff
May we interest you in some perspective shifts? Markets aren’t the only thing in transition this month. From growth factors struggling to deliver, to new thinking on clustering and automation, May is proving to be a reminder that models (and minds) need to stay adaptive.
The Compass
Here's a rundown of what you can find in this edition:
Catching you up on what’s been happening on our side
Newest partner additions to the Quanted data lake
Insights from our chat with AltHub’s CEO, Scott Hall and VP of Partnerships, Jordan Pasternak
Robeco's latest numbers confirm growth factors continue to underdeliver for quants
Highlights from recent quant shifts in the markets
Something to read before trusting your next clustering output
Why we think you should read this intriguing article on fully automated firms
Something Nate Silver said that you may have needed to hear ;)
Insider Info
Last month gave us a chance to trade breadth for depth on both sides of the bridge:
We’ve added many new partners to our ecosystem (see below), spanning fundamental, market, alternative, and macroeconomic sources. It’s a growing range that includes both core staples and more unconventional sources. Exactly the kind of variety that helps uncover orthogonal signals and non-obvious drivers of return.
On the flip side several funds now have our Data Bridge running side‑by‑side with production models. Early verdict: clearer attribution and quicker “go / no‑go” on prospective datasets. Exactly the kind of daylight quants need to keep up with the explosion of available data sets.
Behind the scenes, our internal data graph just crossed 25,000 features. For us this is solid step up in scale, precision, and analytical depth. We’re excited by the trajectory and have plenty more lined up in the weeks ahead.
On the Radar
We've welcomed many new data partners this month, each enriching the pool of features quants have at their fingertips. All ready to unpack, test, and integrate into their strategies. A warm welcome to the partners below:
Our News Sentiment Analysis & Topic Modelling gives quantitative traders a powerful edge by transforming real-time news into structured, tradable signals. Seamlessly integrated into models, it enhances alpha generation, improves timing, and diversifies data inputs—helping traders react faster, backtest smarter, and forecast markets more effectively.
Finage delivers ultra-low latency, highly accurate financial data designed to optimise quantitative models, enhance backtesting, and accelerate strategy deployment across multiple asset classes.
The keys to quantitative analysis include a robust data sample, long data history, structured data and a consistent sample. MedMine’s QuantHC Data feed checks all these boxes with a sample representing more than 20% of the population, more than a decade of history and several years of point in time data. Quantitative analysts are easily able to test different strategies and perform reliable backtests on data that is structured, tickerized and actively maintained for corporate actions like mergers , acquisitions and divestitures.
Provides quant firms with machine readable, time stamped, ticker tagged and category coded newsfeeds delivered in real-time and over 15 years of historical archives to meet the key needs of this segment of financial services.
Delivers ground truth-validated footfall data for 600+ tickers, enabling quant teams to model retail performance with up to 0.98 correlation to reported sales and outperform alternative datasets in backtesting.
Podchaser
Transcribes unstructured podcast audio into quantifiable data, enabling funds to incorporate this rich source into their alpha generation strategies.
The Tradewinds
Expert Exchange
We recently sat down with AltHub’s CEO Scott Hall and VP of Partnerships Jordan Pasternak, who are helping companies across industries unlock new revenue by transforming raw operational data into valuable investment signals.
With 25 years of experience scaling enterprise technology and data businesses, Scott has led high-performing teams across finance and energy markets, driving growth in data management, trading systems, and analytics products for institutional investors. Jordan brings over a decade of experience working closely with early-stage fintech and software ventures, building strategic partnerships and guiding startups toward successful market adoption within institutional finance.
Now, they’re applying that experience to build a platform that turns previously untapped datasets into clean, structured inputs ready for use across institutional investment workflows.
Since founding AltHub, how has alternative data usage in investments changed, and what has been the most formative shift you’ve experienced?
The most formative shift we’ve witnessed is how quickly once-niche datasets—like credit card and geolocation data—have gone from “curiosity” to “table stakes.” This evolution happened in under five years and highlighted how rapidly investors adopt any dataset that delivers a measurable edge. It also reinforced our decision to treat validation and usability as necessities, not afterthoughts.
In the last 18 months, we’ve seen an acceleration in platform and AI development that’s shrinking the gap between what data sellers provide and what investment teams need. Alternative data is being delivered in far more usable and impactful formats, reducing the friction of adoption and making high-quality, insight-ready data more accessible than ever.
What would you say are the three skills or habits that have most shaped your ability to build and scale a differentiated data company?
Patience – Building meaningful relationships and integrations takes time.
Perseverance – Conviction is key when you're introducing a new model into a high-stakes ecosystem. Every proof-of-concept, pilot, and delay has helped us refine the product and build trust.
Ecosystem awareness – Staying plugged into both market and regulatory shifts has helped us evolve AltHub from a connector to a strategic infrastructure layer for the alt-data economy.
Could you provide a couple of technical insights or innovations in alternative data sourcing or processing that you believe would be particularly interesting to investment professionals?
Consumption-based, ticker-level licensing
Instead of paying for entire datasets up front, investment teams can now run targeted queries—by ticker or industry—and pay based on usage. This model aligns cost with value and makes experimentation far more scalable.AI-driven automation
Intelligent agents now assist with entity resolution, automated quality checks, and matching buyers with sellers based on strategy, holdings, or sector interests. These AI tools drastically reduce costs while enhancing precision and speed.Plug-and-play composability
Our data layer enables seamless combination of third-party and proprietary datasets. This plug-and-play approach dramatically reduces the engineering lift needed to test hypotheses or run investment backtests.
Aside from AI, what major trends do you see having the most profound impact on operational data commercialisation over the next decade?
Consumption-based pricing proliferation
As budgets come under more scrutiny, the industry is shifting toward metered billing models that reward relevance and control spend.Regulatory and privacy constraints
Grey-area datasets—like scraped personal data or mobile geolocation—are facing increasing legal and ethical scrutiny. We expect a greater premium on compliant, privacy-conscious datasets.Alpha decay
As alternative data becomes more mainstream, early alpha signals erode. What was once differentiated becomes commoditized, pushing vendors to continuously evolve their offering and stay ahead of the curve.
As more non-traditional providers enter the alternative data market, how do you see the relationship between data vendors and investment teams changing?
With more non-traditional providers entering the space, third-party validators like AltHub are becoming essential. We act as the “initial filter” by validating data quality, assessing liability risk, and enriching raw feeds so they’re ready for financial analysis. This dramatically speeds up the sourcing and diligence process and gives investment teams more confidence in evaluating novel datasets.
What is the next major project or initiative you’re working on, and how do you see it improving the alt-data domain?
We're rolling out a self-serve transformation agent that takes raw datasets and automatically maps them to ticker hierarchies and relevant market data. This turns static files into investment-ready datasets in minutes—not weeks—unlocking massive efficiency gains for both data buyers and sellers.
Anything else you’d like to promote?
AltHub will be exhibiting at Neudata’s New York Summer Data Summit on May 8th. Come visit our booth for a live demo and to see how we’re making alternative data faster, cleaner, and easier to monetize for both providers and users.
Numbers & Narratives
Growth Factors: Why the Numbers Still Don't Add Up
Robeco’s April 2025 factor analysis examines whether growth deserves independent status alongside proven quant factors. The numbers, covering over six decades of US equity data, suggest that while growth narratives are persistent, actual factor returns consistently disappoint.
Key stats from Robeco's analysis:
Classic value and quality factors (like EBITDA/EV, FCF/Price, and operating profitability) maintain robust annual premiums between +5% and +7%.
In contrast, traditional growth definitions underperform significantly:
Sales growth factors returned approximately -2% per year, reflecting persistent investor over-extrapolation.
Profitability growth, often considered a more robust version of growth, still only achieved modest annual returns of about +2%.
Robeco’s own Enhanced Indexing strategy explicitly reflects this insight. Their factor exposures (see chart below or figure 4 of the report) show negligible direct weighting to standalone growth measures, while strong tilts towards value and momentum dominate.
Yet, Robeco highlights a subtlety critical for quant investors: many signals labeled as "growth" (such as earnings revisions or business momentum) are actually proxies for sentiment or short-term information flow. These metrics correlate strongly with known profitable signals, but fail the test of uniqueness required to qualify as standalone factors.
For quants, the practical implications are clear:
Pure growth metrics (EPS trends, sales growth, etc.) rarely justify standalone inclusion in factor models, given their historical performance.
If your model includes explicit growth metrics, carefully test these exposures for redundancy against established factors.
Regular clustering or correlation checks can ensure your factor definitions remain clear, avoiding unintentional duplication and ensuring optimal allocation.
In short, the evidence reinforces skepticism about standalone growth: it might show up in your narratives, but as a factor, the numbers simply don't support its independent allocation.
Source: Robeco July 2024 in the Robeco April 2025, The many faces of growth report.
Market Pulse
Hot off the Vol Press
Volatility surged in April as U.S. tariffs sent the S&P 500 below 5,000 (which has since recovered) and reignited policy-driven uncertainty across asset classes. But while the VIX spike reflected shock, Ben Powell of BlackRock cautions that the rebound was powered more by strong AI-led earnings than a reduction in risk; suggesting quants must distinguish signal from sentiment, especially when volatility clusters around macro catalysts. Robyn Grew of Man Group reframes that volatility as a structural feature, not a disruption, calling for strategies that thrive amid dispersion and adapt across unstable trend cycles. Warren Buffett’s perspective complements this, viewing drawdowns as intrinsic to investing. Volatility, in his framing, is the cost of long-term opportunity, not a risk to be avoided. Together, these views imply that quants must evolve beyond static factor models and design architectures that are not volatility-aware, but instead volatility-integrated, where instability becomes a source of edge rather than friction.
QT Is Still Not a Cutie
With the Fed’s balance sheet down to $6.7 trn, 25 % below its 2022 apex and back to a 22.4 % assets‑to‑GDP ratio it's clear that QT has bitten, yet reserves remain ample enough that policymakers sliced April’s Treasury runoff cap to $5 bn to protect money‑market plumbing. Treasury and MBS holdings alone rolled off about $19 bn in April, keeping term‑premia biasing upward even as the pace moderates. In London, the BoE postponed its £600 mn long‑gilt auction after a tariff‑linked surge pushed 30‑year yields over 5 % and spotlighted how duration risk can derail passive schedules. The BoE's rate sitter's call for “targeted, temporary” QE reframes balance‑sheet policy as a bidirectional shock absorber, not a one‑way valve. Quants should therefore flag state‑contingent liquidity regimes, stress‑test for sudden micro‑QE insertions, and monitor duration gaps as domestic nonbanks absorb heavier gilt supply over the next few quarters.
Navigational Nudges
Clustering Fails When Distance Fails
When clustering breaks down in financial time series, it’s rarely due to the algorithm. The issue usually lies in the distance metric. Cosine, DTW, Mahalanobis — each carries different assumptions about structure, similarity, and noise. In high-dimensional or noisy data, these choices can override the actual information and mislead the clustering entirely.
Here’s where distance metrics go wrong and what to do instead:
1. Cosine Distance: Clean for Direction, Dirty for Noise
Cosine distance is effective when the goal is to compare directional exposure, like factor loadings or normalised returns. It ignores scale, which helps isolate the pattern or profile of variation. But when volatility is low, the angle between vectors becomes unstable and noise dominates. This creates artificial similarity between unrelated series. To mitigate this, normalise returns using EWMA volatility or z-scores. If clusters still appear overly uniform, revisit your assumptions about the signal-to-noise structure.
2. DTW: Powerful, but Prone to Overfitting
Dynamic Time Warping is useful when timing mismatches are meaningful, such as delayed responses across sectors or markets. However, it can over-align noise, bending the series in ways that fit randomness rather than real patterns. Adding constraints like Sakoe-Chiba bands can limit this overfitting, and derivative DTW can help suppress random fluctuations. For shorter time series, simpler distance metrics may be more appropriate.
3. Mahalanobis: Smart with Good Covariance, Risky Without It
Mahalanobis distance captures co-movement across multiple variables, making it valuable in a factor-driven world. But the quality of results depends on the stability of your covariance estimate. With limited samples or fat-tailed returns, the estimation error can produce misleading proximity. Robust estimators like Ledoit-Wolf shrinkage or M-estimators improve reliability. It's also worth testing cluster stability over time — if membership flips frequently, the metric may be overly sensitive to short-term noise in correlation structure.
4. If Clusters Flip, Blame the Metric First
Unstable clustering often points to poor distance specification rather than poor data. A quick test is to apply multiple metrics across the same data and track agreement. Low overlap suggests structural ambiguity or a mismatch between metric assumptions and data behaviour. In these cases, building a voting system across distance types can help. Accept only clusters that appear consistently. Others may require context-specific modeling or more refined feature engineering.
5. One Distance Doesn’t Work Everywhere
Every distance metric carries a view about what matters — alignment, direction, spread, or factor structure. In quiet markets they often produce similar outcomes. In noisy markets, they diverge. That divergence is where useful information lives, as long as you know what each metric is prioritising. Choosing a distance metric is a modeling decision. It’s a bet on what structure you believe exists, and what kind of noise you expect to dominate. Reliable, stable estimates are especially critical if you're using clustering outputs in downstream tasks like risk targeting or minimum variance portfolio optimisation.
In the end, clustering outcomes are only as reliable as the structure your distance metric is built to recognise.
The Knowledge Buffet
📝 What fully automated firms will look like 📝
by Dwarkesh Patel
Most of us still picture AI as a smarter teammate. Here's a piece that will challenge that ideology. It forces a different lens — firms made entirely of AIs, scaling through replication and merge, not headcount. It’s speculative, sure, but as a quant, the parts on coordination costs, information transfer, and compute-as-talent feel highly relevant and we couldn't help but recommend it. Worth the read even if it's just to reframe how to think about scale.
The Closing Bell
“Distinguishing the signal from the noise requires both scientific knowledge and self-knowledge: the serenity to accept the things we cannot predict, the courage to predict the things we can, and the wisdom to know the difference.”
- Nate Silver